
Educational Resources
Benefits of MF
Research, historical studies, and portfolio illustrations on the role of managed futures.
The Benefits of Managed Futures
The addition of managed futures to a client's portfolio does not mean that a portfolio will be profitable or that it will not experience substantial losses and that the studies conducted in the past may not be indicative of current time periods or of the performance of any individual CTA.
A Well Balanced Portfolio
A well balanced managed futures portfolio can provide a diversified global investment opportunity for investors. The main benefits include:
- Opportunity to reduce the volatility risk of a portfolio
- Opportunity to enhance a portfolio's returns
- The ability to profit in both rising and falling markets
- The opportunity the participate in global markets
The Opportunity for Risk Reduction through Diversification
Managed Futures offer the opportunity to reduce the volatility risk of a traditional stock/bond portfolio. Modern Portfolio Theory was developed by the Nobel Prize winning economist Dr. Harry M. Markowitz. He stated that a portfolio’s efficiency can be increased by diversifying across asset classes that have low to negative correlations. The goal is to decrease the portfolio’s volatility risk.
The following table show the correlation between stocks, bonds, and managed futures. Two perfectly correlated investments (ones that move in the same direction to the same degree) would have a correlation of 1.0 while a perfectly negative correlated investments (ones that move in the opposite direction to the same degree) would have a correlation -1.0. The goal is to combine investments that have a low correlation. Correlations between -0.5 and +0.5 would be desirable.
Table 1 - Correlation of Asset Classes from December 1990 - December 2025
| S&P 500 TR Index | Bond Index | AG CTA Index | |
|---|---|---|---|
| S&P 500 TR Index | 1.00 | 0.20 | -0.04 |
| Bond Index | 0..20 | 1.00 | 0.15 |
| AG CTA Index | -0.04 | 0.15 | 1.00 |
The Opportunity to Enhance a Traditional Portfolio’s Return
The most famous modern study of managed futures was conducted by Dr. John Lintner of Harvard University in 1983. In his study, “The Potential Role of Managed Commodity-Financial Futures Accounts in Portfolios of Stocks and Bonds,” Dr. Lintner reported that as an independent investment, managed futures compared favorably with stocks and bonds. Dr. Lintner found that "the combined portfolios of stocks (or stocks and bonds) after including judicious investments in leveraged managed futures accounts show substantially less risk at every possible level of expected return than portfolios of stocks (or stocks and bonds) alone.”
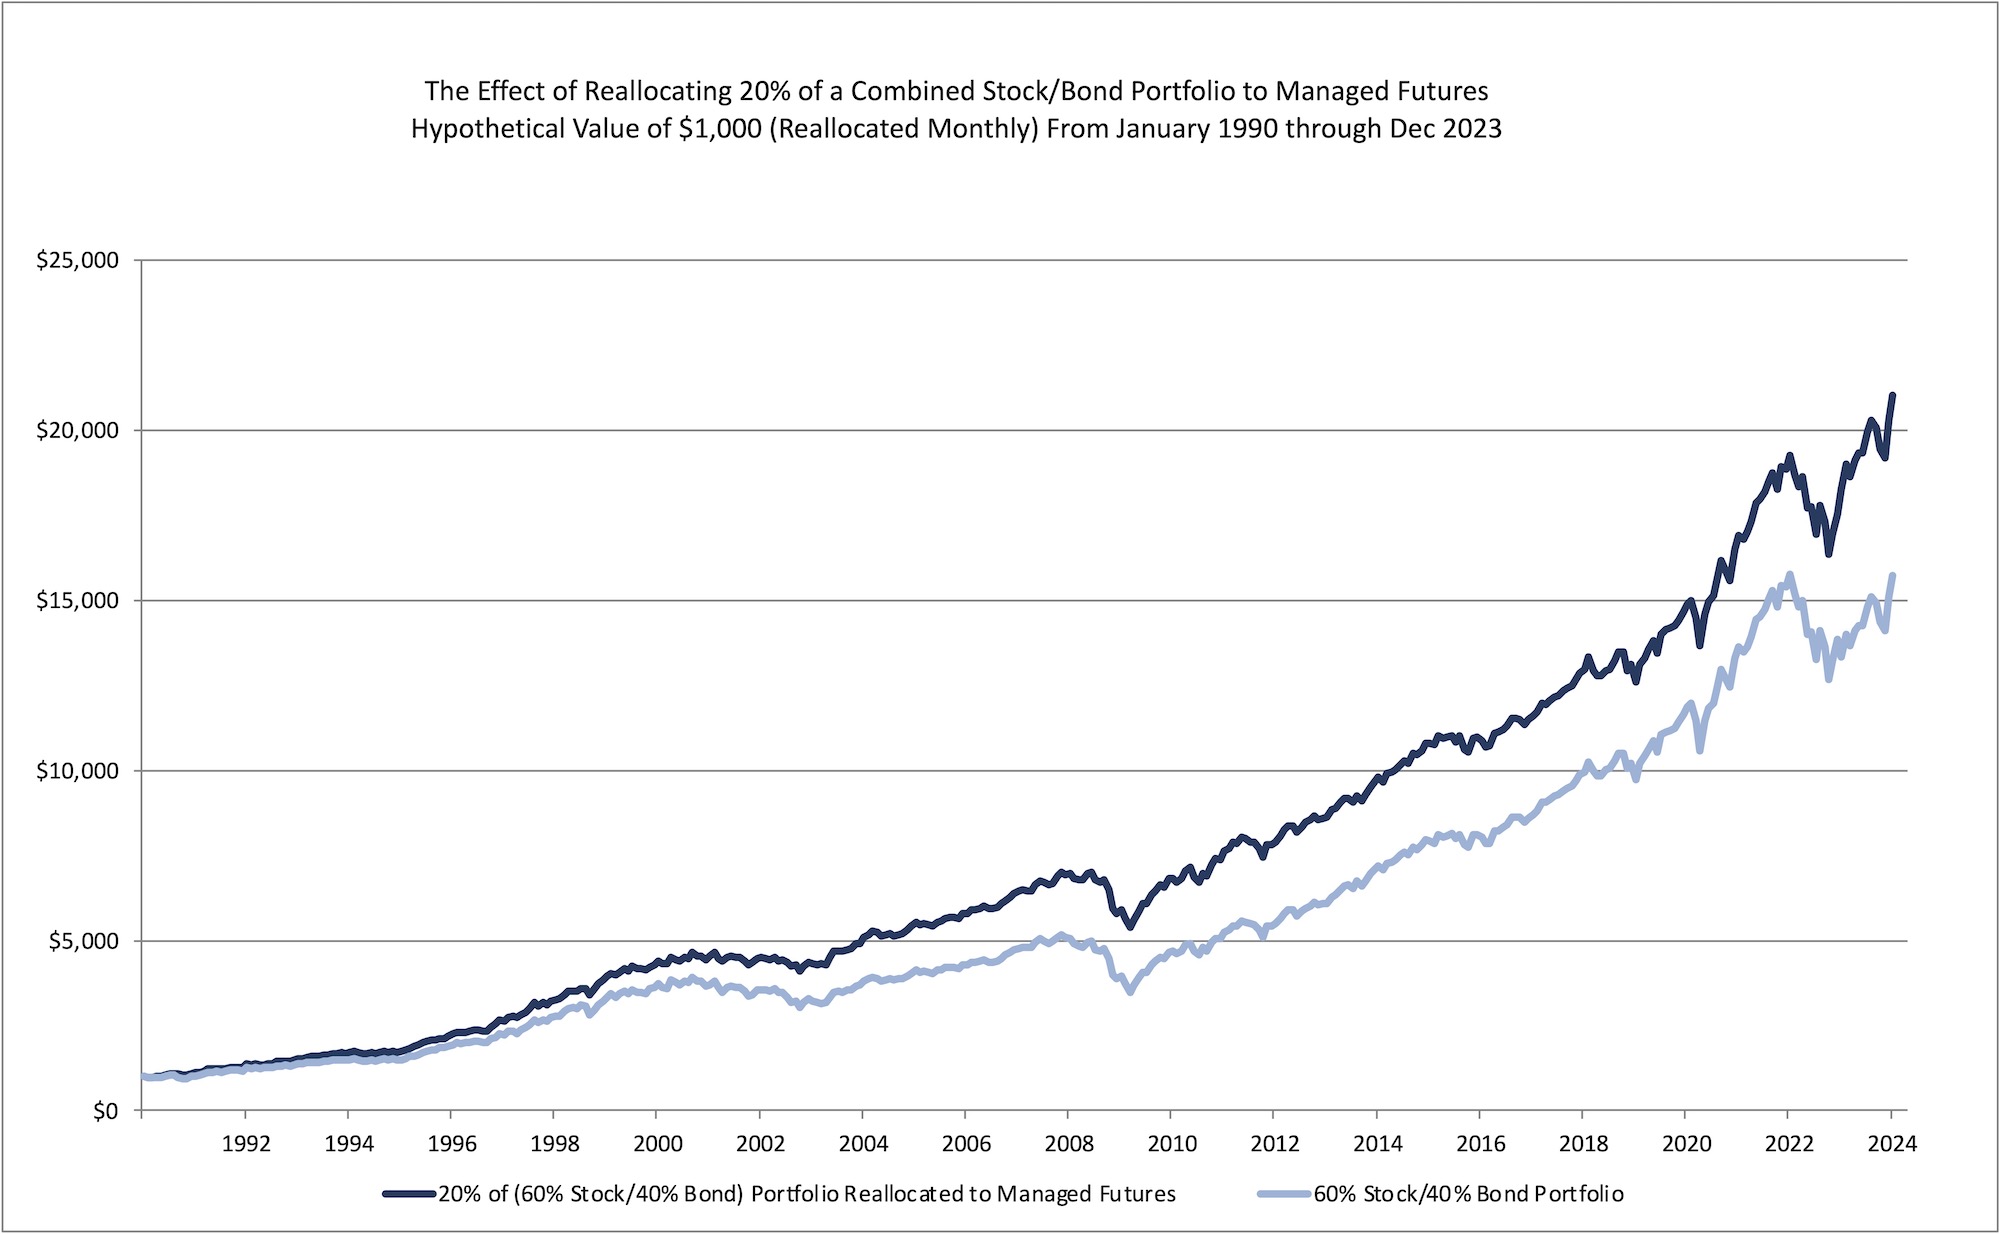
The chart below illustrates how reallocating 20% to a Managed Futures Portfolio (based on the results of the AG CTA Index) to a traditional portfolio of 40% bonds (based on the Barclay Bank's Aggregate Bond Index) and 60% stocks (based on the S&P 500 Price Index) since January 1990.
Chart 1 - The Effect of Reallocating 20% of a Traditional Portfolio to Managed Futures
The Opportunity for Enhanced Return
Goldman Sachs conducted a study regarding the ability of futures to enhance the returns of a traditional investment portfolio. The study covered a 25-year period and concluded that by “..allocating only 10% of a securities portfolio to commodities, investors can vastly improve their performance." This conclusion was supported by another study published by the Chicago Mercantile Exchange (“CME”), one of the world's leading futures exchanges. According to the CME study, "Portfolios with as much as 20% of assets in managed futures yield up to 50% more than a portfolio of stocks and bonds alone."
The Ability to Profit in any Economic Environment
Managed futures investors can profit in many different types economic environments. This is partly because the futures markets are diverse and often exhibit independent price movement. Commodity Trading Advisors can take advantage of price trends regardless of whether the market is rising or falling. For instance, if they feel that the markets have the potential to rise then they can buy in anticipation of a price increase. Conversely, if they anticipate the market to fall then they can sell short.
There is no restriction on short selling in the futures market as in the stock market.
During periods of hyperinflation, hard commodities such as precious metals, energies, grains, livestock, and currencies often do well. During deflationary times, the futures markets can provide an opportunity to profit by selling short in a falling market with the expectation of buying back the position at a lower price. CTAs can also use sophisticated spread strategies that combine futures and options on futures positions in an attempt to profit during periods of flat or neutral markets.
The Ability to Participate in Global Markets
With the expansion of global futures exchanges, CTAs can now diversify their clients’ portfolios by geography as well as by market sector. Investors can participate in at least 150 worldwide futures markets trading a variety of products including financial instruments, stock indexes, precious metals, agricultural commodities, tropical products, currencies, and energy products. Trading advisors have many possible opportunities to profit from the broad array of non-correlated markets. Increased market volume and liquidity makes the markets more attractive as market efficiencies improve. CTAs offer investors benefits similar to those experienced with mutual funds and other investment advisors. These include:
- Full-time commitment to the markets and their trading programs
- A disciplined trading approach
- Risk management strategies that attempt to control losses and protect profits
- Trading and risk management strategies that endeavor to balance risk with reward.
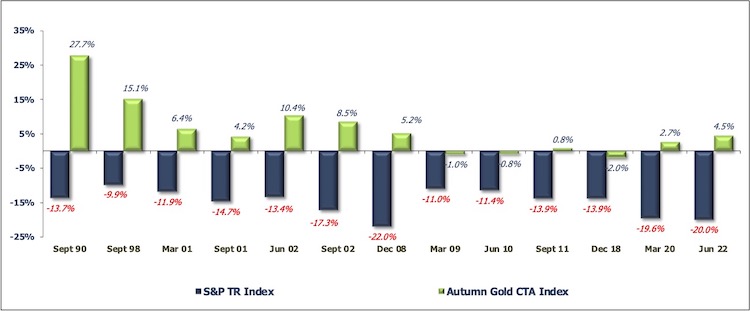
Return Comparisons During Losing Periods in the Stock Market
The chart below demonstrates how the Autumn Gold CTA Index performed during periods when the S&P 500 TR Index experienced quarterly losses greater than 10%. The Autumn Gold CTA Index reflects the average performance of Commodity Trading Advisors (CTAs) reporting to the Autumn Gold Database. The chart demonstrates that the Autumn Gold CTA index outperformed the S&P 500 TR Index during periods when the S&P 500 TR Index incurred quarterly losses in excess of 10%. In every instance, when the S&P 500 TR Index incurred these losses, the Autumn Gold CTA index produced positive returns or losses less than 2%.
Chart 3 - CTA Return during Periods when the S&P lost more than 10% in a Quarter (From Jan 1990 - Dec 2025)
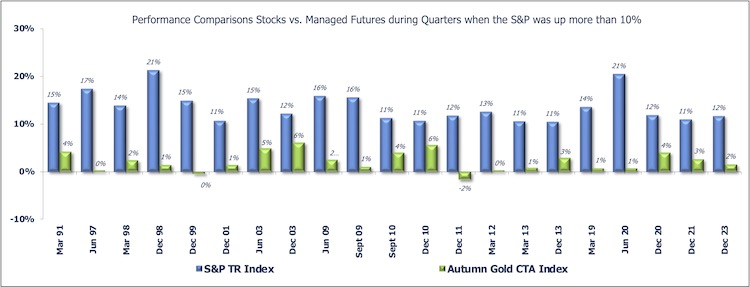
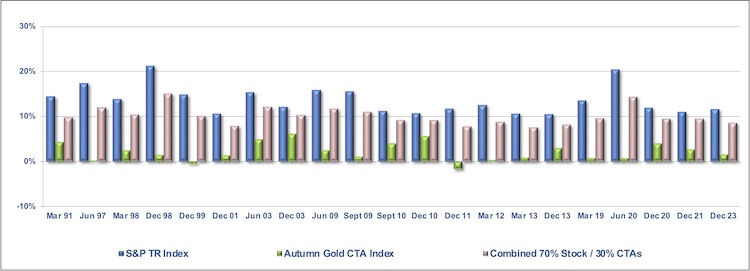
Return Comparisons During Gaining Periods in the Stock Market
The chart below demonstrates how the Autumn Gold CTA Index performed during periods when the S&P 500 TR Index experienced quarterly gains greater than 10%. The Autumn Gold CTA Index reflects the average performance of Commodity Trading Advisors (CTAs) reporting to the Autumn Gold Database. The chart demonstrates that the Autumn Gold CTA index produced gains or minimal losses during periods when the S&P 500 TR Index incurred quarterly gains in excess of 10%. In every instance, when the S&P 500 TR Index incurred these gains, the Autumn Gold CTA index produced positive return or losses less than 2%.
Chart 4 - CTA Return during Periods when the S&P gained more than 10% in a Quarter (Jan 1990 - Dec 2025)
Portfolio Benefits
How does this benefit an investor’s portfolio? The charts below show the result of adding 30% to a managed futures portfolio (based on the Autumn Gold CTA Index). During quarters that the S&P 500 TR Index was down more than 10%, reallocating 30% of the portfolio to managed futures would have reduced the severity of the portfolio's quarterly losses. During quarters that the S&P 500 TR Index was up more than 10%, reallocating 30% of the portfolio to managed futures did not significantly lower the portfolio’s quarterly gains. Thus in this analysis the reduction of volatility outweighs the reduction in return.
Chart 5 - Combined Returns during Periods when the S&P lost more than 10% in a Quarter (From Jan 1990 - Dec 2025)
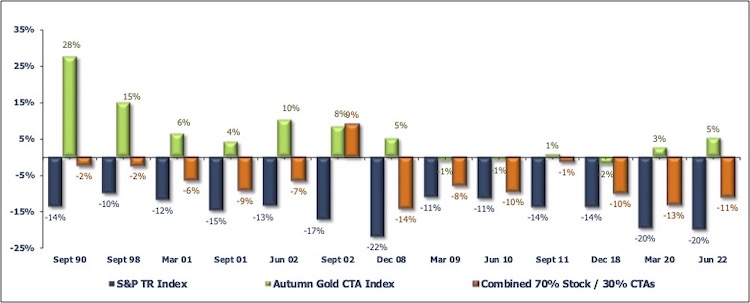
Chart 6 - Combined Returns during Periods when the S&P gained more than 10% in a Qtr (Jan 1990 - Sep 2024)
Notes:
Please note that the data used in Chart 1, 3, 4, 5 & 6 was constructed using the Autumn Gold CTA Index
For Chart 1 - Stocks are represented by the S&P 500 Total Return Index from December 1990 to the end of Data and by the S&P 500 Price Index adjusted for dividends from January 1990 through November 1990. The S&P 500 indices are designed to reflect all sectors of the U.S. equity markets. The S&P 500 includes 500 blue chip, large cap stocks, which together represent about 75% of the total U.S. equities market. Companies eligible for addition to the S&P 500 have market capitalization of at least US$3.5 billion. The TR Index accounts for the reinvestment of dividends.
Bonds are represented by the Bloomberg US Aggregate Bond Index (formerly known as the Barclay's US Aggregate Bond Index and as the Lehman US Aggregate Bond Index). The U.S. Bond Index is a broad-based benchmark that measures the investment grade, U.S. dollar-denominated, fixed-rate taxable bond market, including Treasuries, government-related and corporate securities, MBS (agency fixed-rate and hybrid ARM pass- throughs), ABS, and CMBS.
Managed Futures are represented by the Autumn Gold CTA Index. The Autumn Gold CTA Index is comprised of the client performance of all CTA programs included in the AG database and does not represent the complete universe of CTAs. CTA programs with proprietary performance are not included. Monthly numbers are updated until 45 days after the end of the month.
CTA INDEXES DO NOT REPRESENT THE COMPLETE UNIVERSE OF CTAS. INVESTORS SHOULD NOTE THAT IT IS NOT POSSIBLE TO INVEST IN THESE INDEXES.
The addition of managed futures to a client's portfolio does not mean that a portfolio will be profitable or that it will not experience substantial losses and that the studies conducted in the past may not be indicative of current time periods or of the performance of any individual CTA.
RISK DISCLOSURE
PAST PERFORMANCE IS NOT NECESSARILY INDICATIVE OF FUTURE RESULTS.
THE RISK OF TRADING COMMODITY FUTURES, OPTIONS AND FOREIGN EXCHANGE ("FOREX") IS SUBSTANTIAL. THE HIGH DEGREE OF LEVERAGE ASSOCIATED WITH COMMODITY FUTURES, OPTIONS AND FOREX CAN WORK AGAINST YOU AS WELL AS FOR YOU. THIS HIGH DEGREE OF LEVERAGE CAN RESULT IN SUBSTANTIAL LOSSES, AS WELL AS GAINS. YOU SHOULD CAREFULLY CONSIDER WHETHER COMMODITY FUTURES, OPTIONS AND FOREX IS SUITABLE FOR YOU IN LIGHT OF YOUR FINANCIAL CONDITION. IF YOU ARE UNSURE YOU SHOULD SEEK PROFESSIONAL ADVICE. PAST PERFORMANCE DOES NOT GUARANTEE FUTURE SUCCESS. IN SOME CASES MANAGED ACCOUNTS ARE CHARGED SUBSTANTIAL COMMISSIONS AND ADVISORY FEES. THOSE ACCOUNTS SUBJECT TO THESE CHARGES, MAY NEED TO MAKE SUBSTANTIAL TRADING PROFITS JUST TO AVOID DEPLETION OF THEIR ASSETS. EACH COMMODITY TRADING ADVISOR ("CTA") IS REQUIRED BY THE COMMODITY FUTURES TRADING COMMISSION ("CFTC") TO ISSUE TO PROSPECTIVE CLIENTS A RISK DISCLOSURE DOCUMENT OUTLINING THESE FEES, CONFLICTS OF INTEREST AND OTHER ASSOCIATED RISKS. A HARD COPY OF THESE RISK DISCLOSURE DOCUMENTS ARE READILY AVAILABLE BY CLICKING ON EACH CTA'S "REQUEST DISCLOSURE DOCUMENT" BUTTON. THE FULL RISK OF COMMODITY FUTURES, OPTIONS AND FOREX TRADING CAN NOT BE ADDRESSED IN THIS RISK DISCLOSURE STATEMENT. NO CONSIDERATION TO INVEST SHOULD BE MADE WITHOUT THOROUGHLY READING THE DISCLOSURE DOCUMENT OF EACH OF THE CTAS IN WHICH YOU MAY HAVE AN INTEREST. REQUESTING A DISCLOSURE DOCUMENT PLACES YOU UNDER NO OBLIGATION AND EACH DOCUMENT IS PROVIDED AT NO COST. THE CFTC HAS NOT PASSED UPON THE MERITS OF PARTICIPATING IN ANY OF THE FOLLOWING PROGRAMS NOR ON THE ADEQUACY OR ACCURACY OF THE DISCLOSURE DOCUMENTS. OTHER DISCLOSURE STATEMENTS ARE REQUIRED TO BE PROVIDED TO YOU BEFORE AN ACCOUNT MAY BE OPENED FOR YOU.
PROSPECTIVE CLIENTS SHOULD NOT BASE THEIR DECISION ON INVESTING IN THIS TRADING PROGRAM SOLELY ON THE PAST PERFORMANCE PRESENTED. ADDITIONALLY, IN MAKING AN INVESTMENT DECISION, PROSPECTIVE CLIENTS MUST ALSO RELY ON THEIR OWN EXAMINATION OF THE PERSON OR ENTITY MAKING THE TRADING DECISIONS AND THE TERMS OF THE ADVISORY AGREEMENT INCLUDING THE MERITS AND RISKS INVOLVED.
LIMITATIONS OF RANKINGS ARE THAT ONLY THOSE ADVISORS OR POOL OPERATORS THAT SUBMITTED THEIR PERFORMANCE DATA TO AUTUMNGOLD WERE RATED. THE ENTIRE CTA UNIVERSE IS NOT INCLUDED IN THE RANKINGS. THE PERFORMANCE INFORMATION PROVIDED WHEREIN HAS NOT BEEN VERIFIED BY AUTUMNGOLD. THE PAST PERFORMANCE IS NOT NECESSARILY INDICATIVE OF FUTURE RESULTS.
AUTUMN GOLD CTA INDEXES ARE NON-INVESTABLE INDEXES COMPRISED OF THE CLIENT PERFORMANCE OF CTA PROGRAMS INCLUDED IN THE AUTUMN GOLD DATABASE AND DO NOT REPRESENT THE COMPLETE UNIVERSE OF CTAS. INVESTORS SHOULD NOTE THAT IT IS NOT POSSIBLE TO INVEST IN THESE INDEXES.