
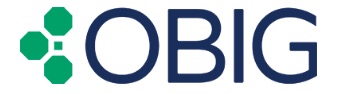
Growth of $1,000 VAMI and Monthly Return
Trading Description, Risk Strategy & Background
The O'Brien Investment Group (OBIG) Quantitative Global Macro Futures Program is a systematic strategy diversified across 45 different financial and commodity futures markets including global stock indices, global interest rates, currencies, metals, energies, grains, softs and meats. The foundation of the strategy are long-term trend following models seeking to capture absolute returns. Trend following has historically generated "crisis alpha" during times of stress in the markets. The strategy also incorporates a series of options on futures models with a goal of smoothing out the return stream and to generate positive returns when implied volatility levels are attractive. The option models will not sell naked short open positions. Only covered positions or long puts / long call positions are considered.
N/A
The Chicago based O’Brien Investment Group, LLC (OBIG) is registered with the CFTC as a Commodity Trading Advisor (CTA). OBIG is also a member of the National Futures Association (NFA). OBIG has six investment professionals dedicated to research, trading, operations and risk management. The Quantitative Global Macro Fund strategy has 3 investment committee members that monitor the trading and operations of the portfolio daily. The team also has an in-depth weekly call on the strategy and a quarterly deeper dive into the trading, market and model results and future research initiatives.
| Year | Jan | Feb | Mar | Apr | May | Jun | Jul | Aug | Sep | Oct | Nov | Dec | ROR (YTD) | Max DD |
|---|---|---|---|---|---|---|---|---|---|---|---|---|---|---|
| 2026 | -0.40% | 2.92% | -0.47% | 1.97% | 0.97% | -4.02% | 0.82% | -4.02% | ||||||
| 2025 | 1.09% | -5.92% | -2.87% | 3.82% | -5.11% | -2.89% | -2.32% | -3.33% | 4.12% | 1.40% | -0.65% | 3.22% | -9.65% | -17.45% |
| 2024 | 0.00% | 9.23% | 0.56% | 5.15% | -3.42% | 1.45% | 0.00% | 1.13% | 4.24% | -6.99% | 7.47% | 0.10% | 19.38% | -6.99% |
| 2023 | -2.51% | -0.15% | -4.05% | 6.49% | 4.56% | -0.04% | -2.04% | -4.38% | 3.08% | -3.64% | -2.39% | 5.50% | -0.38% | -9.22% |
| 2022 | 1.99% | 3.80% | 8.78% | 2.89% | -0.26% | 0.83% | -3.85% | -0.10% | 3.72% | 1.20% | -8.23% | 0.44% | 10.73% | -8.23% |
| 2021 | -0.25% | 9.78% | -1.28% | 3.12% | -2.48% | -1.22% | 2.08% | 0.57% | 3.92% | 1.97% | -2.74% | -3.94% | 9.12% | -6.58% |
Accounting Notes: The strategy was opened up to outside investors in July 2017. The first external managed account began trading July 19, 2017. The performance for July 2017 does not represent a full month. Furthermore, the actual trading results for July 2017 and going forward are pro forma and net of all trading costs to a 1% Management Fee and a 20% Incentive Fee paid quarterly. Separately Managed Account performance can be higher or lower than the below reported performance of the program depending upon several factors such as commission and fee levels, investment amount, duration, the actual prices received and government taxes (if applicable). The results are based on pro forma adjustments assuming the above stated fee structure. In reality, accounts may have different fee structures, higher or lower commission rates and can be traded with a higher or lower leverage which could result in significant different performance in an actual account.
| Year | Yearly Return | Max DD |
|---|---|---|
| 2026 | 0.82% | -4.02% |
| 2025 | -9.65% | -17.45% |
| 2024 | 19.38% | -6.99% |
Accounting Notes:
The strategy was opened up to outside investors in July 2017. The first external managed account began trading July 19, 2017. The performance for July 2017 does not represent a full month. Furthermore, the actual trading results for July 2017 and going forward are pro forma and net of all trading costs to a 1% Management Fee and a 20% Incentive Fee paid quarterly. Separately Managed Account performance can be higher or lower than the below reported performance of the program depending upon several factors such as commission and fee levels, investment amount, duration, the actual prices received and government taxes (if applicable). The results are based on pro forma adjustments assuming the above stated fee structure. In reality, accounts may have different fee structures, higher or lower commission rates and can be traded with a higher or lower leverage which could result in significant different performance in an actual account.(QEPs) Qualified Eligible Investors Only:
A Qualified Eligible Person must meet the following two requirements: 1) the investor must first be an accredited investor. The most common ways for this are to either have a net worth of $1,000,000 or more OR an annual income of $200,000 or more for the last two years OR, combined with a spouse, $300,000 per year for two years, 2) the investor must meet an additional portfolio requirement, which is having $4,000,000 in securities holdings OR the person must have on deposit with a Futures Commission Merchant at least $400,000 in exchange-specified initial margin and option premiums, and required minimum security deposit for retail forex transactions).Exemptions:
PURSUANT TO AN EXEMPTION FROM THE COMMODITY FUTURES TRADING COMMISSION IN CONNECTION WITH THE ACCOUNTS OF QUALIFIED ELIBIBLE PERSONS, THIS BROCHURE OR ACCOUNT DOCUMENT IS NOT REQUIRED TO BE, AND HAS NOT BEEN, FILED WITH THE COMMISSION. THE COMMODITY FUTURES TRADING COMMISSION DOES NOT PASS UPON THE MERITS OF PARTICIPATING IN A TRADING PROGRAM OR UPON THE ADEQUANCY OR ACCURACY OF THE COMMODITY TRADING ADVISOR DISCLOSURE. CONSEQUENTLY, THE COMMODITY FUTURES TRADING COMMISSION HAS NOT REVIEWED OR APPROVED THIS TRADING PROGRAM OR THIS BROCHURE OR ACCOUNT DOCUMENT.Risk Disclosure
THIS MATTER IS INTENDED AS A SOLICITATION FOR MANAGED FUTURES. THE RISK OF TRADING COMMODITY FUTURES, OPTIONS, FOREIGN EXCHANGE ('FOREX') AND/OR CRYPTOCURRENCIES IS SUBSTANTIAL. THE HIGH DEGREE OF LEVERAGE ASSOCIATED WITH COMMODITY FUTURES, OPTIONS AND FOREX CAN WORK AGAINST YOU AS WELL AS FOR YOU. THIS HIGH DEGREE OF LEVERAGE CAN RESULT IN SUBSTANTIAL LOSSES, AS WELL AS GAINS. YOU SHOULD THEREFORE CAREFULLY CONSIDER WHETHER SUCH TRADING IS SUITABLE FOR YOU IN LIGHT OF YOUR FINANCIAL CONDITION. IF YOU ARE UNSURE YOU SHOULD SEEK PROFESSIONAL ADVICE. AN INVESTOR MUST READ AND UNDERSTAND THE CTA’S CURRENT DISCLOSURE DOCUMENT BEFORE INVESTING. THERE ARE NO GUARANTEES OF PROFIT NO MATTER WHO IS MANAGING YOUR MONEY.PAST PERFORMANCE DOES NOT GUARANTEE FUTURE SUCCESS. IN SOME CASES MANAGED ACCOUNTS ARE CHARGED SUBSTANTIAL COMMISSIONS AND ADVISORY FEES. THOSE ACCOUNTS SUBJECT TO THESE CHARGES, MAY NEED TO MAKE SUBSTANTIAL TRADING PROFITS JUST TO AVOID DEPLETION OF THEIR ASSETS. EACH COMMODITY TRADING ADVISOR ("CTA") IS REQUIRED BY THE COMMODITY FUTURES TRADING COMMISSION ("CFTC") TO ISSUE TO PROSPECTIVE CLIENTS A RISK DISCLOSURE DOCUMENT OUTLINING THESE FEES, CONFLICTS OF INTEREST AND OTHER ASSOCIATED RISKS. A HARD COPY OF THESE RISK DISCLOSURE DOCUMENTS ARE READILY AVAILABLE BY CLICKING ON EACH CTA'S "REQUEST DISCLOSURE DOCUMENT" BUTTON.
THE FULL RISK OF COMMODITY FUTURES, OPTIONS AND FOREX TRADING CAN NOT BE ADDRESSED IN THIS RISK DISCLOSURE STATEMENT. NO CONSIDERATION TO INVEST SHOULD BE MADE WITHOUT THOROUGHLY READING THE DISCLOSURE DOCUMENT OF EACH OF THE CTAS IN WHICH YOU MAY HAVE AN INTEREST. REQUESTING A DISCLOSURE DOCUMENT PLACES YOU UNDER NO OBLIGATION AND EACH DOCUMENT IS PROVIDED AT NO COST. THE CFTC HAS NOT PASSED UPON THE MERITS OF PARTICIPATING IN ANY OF THE FOLLOWING PROGRAMS NOR ON THE ADEQUACY OR ACCURACY OF THE DISCLOSURE DOCUMENTS. OTHER DISCLOSURE STATEMENTS ARE REQUIRED TO BE PROVIDED TO YOU BEFORE AN ACCOUNT MAY BE OPENED FOR YOU.
PAST PERFORMANCE IS NOT NECESSARILY INDICATIVE OF FUTURE RESULTS. PROSPECTIVE CLIENTS SHOULD NOT BASE THEIR DECISION ON INVESTING IN THIS TRADING PROGRAM SOLELY ON THE PAST PERFORMANCE PRESENTED. ADDITIONALLY, IN MAKING AN INVESTMENT DECISION, PROSPECTIVE CLIENTS MUST ALSO RELY ON THEIR OWN EXAMINATION OF THE PERSON OR ENTITY MAKING THE TRADING DECISIONS AND THE TERMS OF THE ADVISORY AGREEMENT INCLUDING THE MERITS AND RISKS INVOLVED.
AUTUMN GOLD CTA INDEXES ARE NON-INVESTABLE INDEXES COMPRISED OF THE CLIENT PERFORMANCE OF CTA PROGRAMS INCLUDED IN THE AUTUMN GOLD DATABASE AND DO NOT REPRESENT THE COMPLETE UNIVERSE OF CTAS. INVESTORS SHOULD NOTE THAT IT IS NOT POSSIBLE TO INVEST IN THESE INDEXES.